Plotting hierarchical diversity
HierDplot.RdPlotting hierarchical diversity map
Arguments
| x | The diversity structure data produced from "HierDstr" |
|---|---|
| layout | The plot layout, either a valid string, a function, a matrix, or a data.frame, see "ggraph". |
| ... | Arguments passing to igraph |
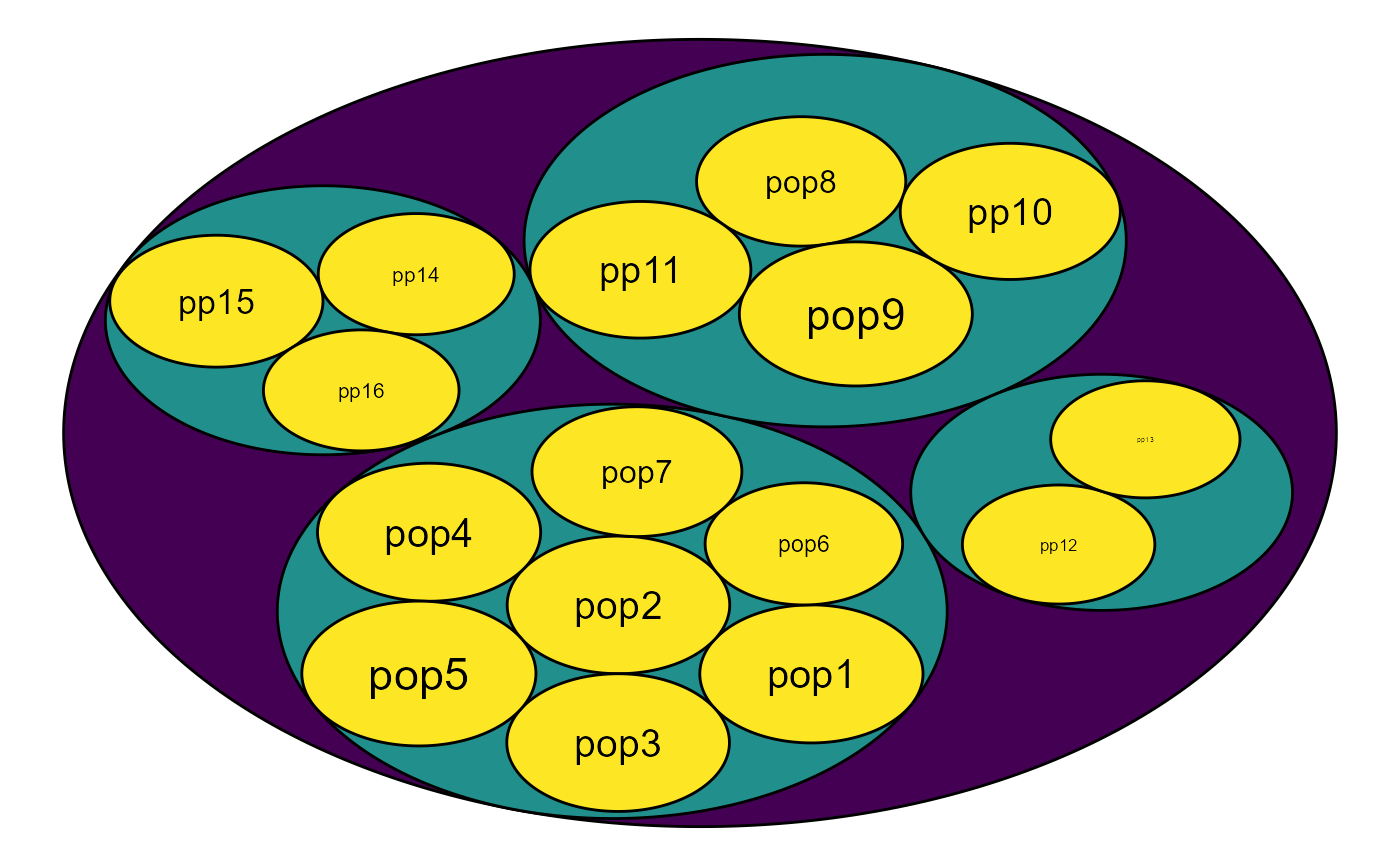
Details
Plot the hierarchical diversity
Value
A HierDmap plot
References
Pedersen, T. L., Pedersen, M. T. L., LazyData, T. R. U. E., Rcpp, I., & Rcpp, L. (2017). Package "ggraph". Retrieved January, 1, 2018.
Qin, X. (2019). HierDpart: partitioning hierarchical diversity and differentiation across metrics and scales, from genes to ecosystems. R package version 0.5. 0 https://cran.r-project.org/package=HierDpart.
Author
qinxinghu@gmail.com
Examples
### load data f <- system.file('extdata',package='HierDpart') infile <- file.path(f, "Island.gen") ### calculate diversity values HierDisland=HierDq(infile,q=2,ncode=3,nreg = 4,r=c(7,4,2,3)) hie_mapdata=HierDstr(HierDisland) HierDplot(hie_mapdata,layout = 'circlepack')#>