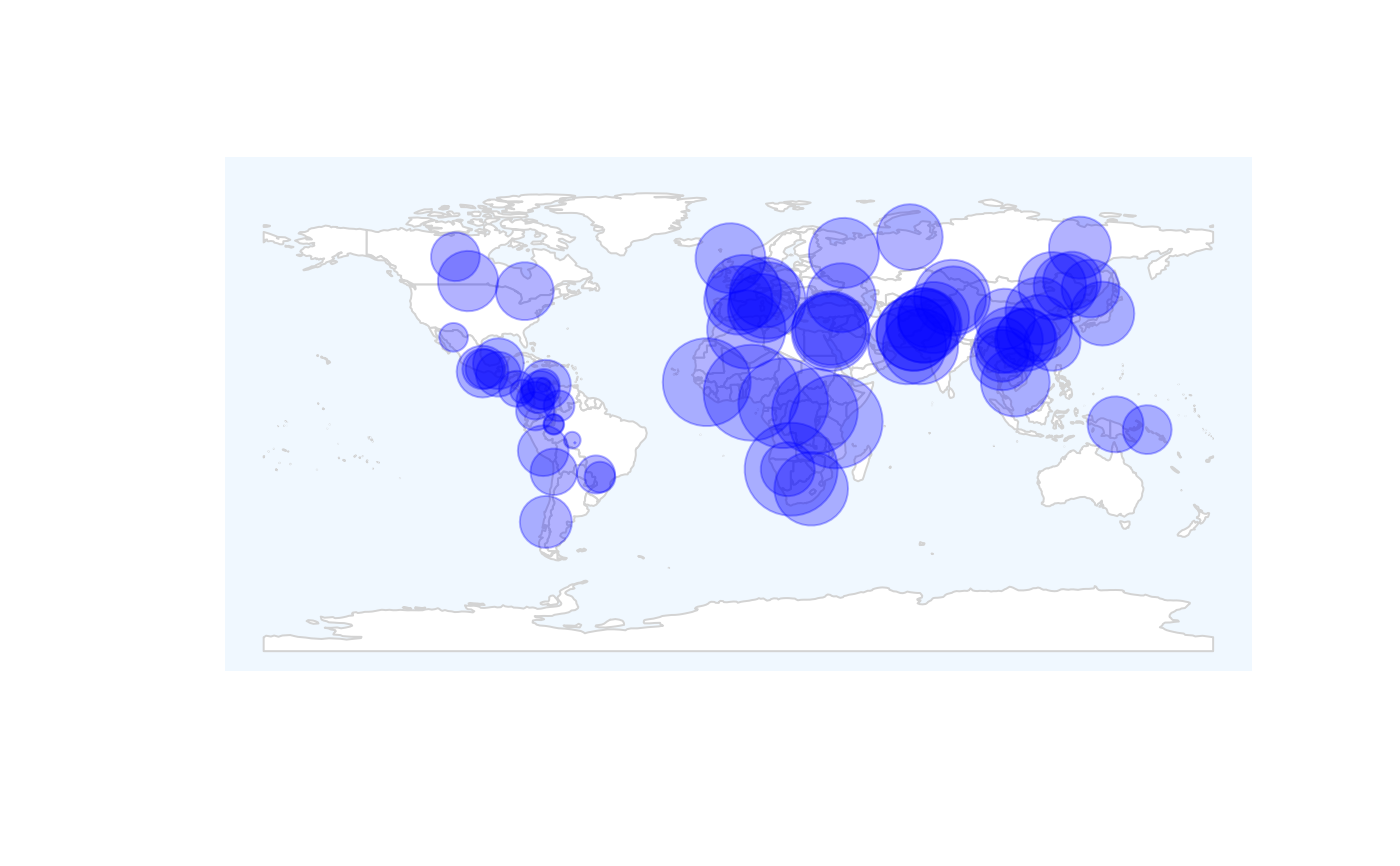
Method of plot geographic diveristy map in R
rDivgeomap.RdPlot the geographic map of genetic diversity profiles.
rDivgeomap(x, y , xlim = c(-180, 180), ylim = c(-90, 90),
asp = 1, bg = "aliceblue", cols = "white", fill = T,
border = "lightgrey", wrap = c(-180, 180),
col =grDevices::rgb(red = 0, green = 0, blue = 1, alpha = 0.3),
size, pch = 20, ...)
Arguments
| x | The longitude of the location |
|---|---|
| y | The latitude of the location |
| xlim | Used to plot the range of the longitude in world map. |
| ylim | The range of the latitude in a world map. |
| asp | Plot parameter used in rgeos |
| bg | Plot parameter, colour pattern used to fill the points |
| cols | The colour of background |
| fill | Fill the points, default is True. |
| border | The border of map |
| wrap | The range of coordinates |
| col | The colour of points |
| size | The size of the diversity in a location. |
| pch | The plot parameter, the indicator of the point. |
| ... | Arguments passing to regos plot |
Details
This function plot geographic map using "rgeos", a class for representing polygons composed of multiple contours, some of which may be holes.
Value
A diversity map in a world map
References
Wickham, H. (2011). ggplot2. Wiley Interdisciplinary Reviews: Computational Statistics, 3(2), 180-185.
Bivand, R., & Rundel, C. (2017). rgeos: interface to geometry engine-open source (GEOS). R package version 0.3-26.
Qin, X. (2019). HierDpart: partitioning hierarchical diversity and differentiation across metrics and scales, from genes to ecosystems. R package version 0.5. 0 https://cran.r-project.org/package=HierDpart.
Author
qinxinghu@gmail.com